


How to Build Interactive JavaScript Charts with TradingView Lightweight Charts
Paid Advertisement: This article contains sponsored content. The publisher retains editorial control over the research, analysis, and conclusions. |
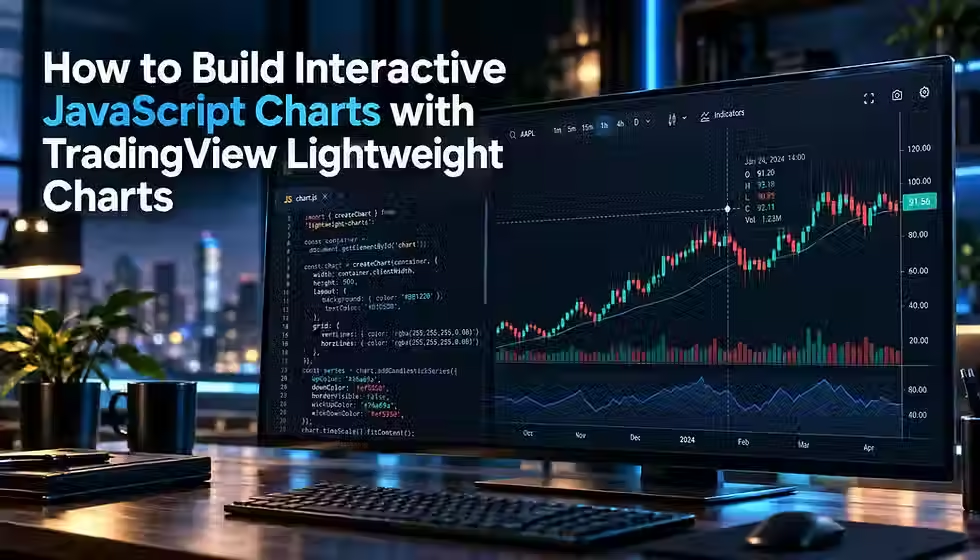
A price chart looks simple until you have to ship one. The data arrives late or out of order, the container collapses to zero height, the legend has to follow the cursor, and a tutorial you copied from a few years ago calls methods that no longer exist. TradingView's Lightweight Charts is a small canvas library built for this job, and its fifth major version changed the API enough to break older snippets. This guide builds one chart step by step against version 5.2.1, then helps you decide whether the library fits your project.
TL;DR
Lightweight Charts is a client-side, open-source (Apache-2.0) canvas library for financial and time-series charts. It draws the data you supply and does not provide market data.
In version 5 you import a series type and call chart.addSeries(LineSeries, options). The older addLineSeries and addCandlestickSeries helpers were replaced.
Load history once with setData, then push live changes with update instead of replacing the whole dataset on every tick.
Indicators, drawing tools, toolbars, symbol search, and saved layouts are the application's job, although plugins can help.
Accessibility needs deliberate work, and the license asks you to credit TradingView. Check the NOTICE file before you ship.
To build interactive JavaScript charts with TradingView Lightweight Charts, install the lightweight-charts npm package, create a chart with createChart on a sized container, add a series with chart.addSeries, load chronological data with setData, and push live changes with update. Then add crosshair events, markers, panes, and responsive sizing as the project requires. |
Table of Contents
What Lightweight Charts Is and Is Not
TradingView Lightweight Charts is a client-side JavaScript library that draws interactive financial charts on an HTML canvas. TradingView, Inc. publishes it on npm under the Apache-2.0 license, and the package ships with TypeScript declarations. Its job is narrow by design: given arrays of time-stamped values, it renders them quickly in a small bundle and lets users pan, zoom, and inspect them with a crosshair.
This guide targets version 5.2.1, the latest release on npm when it was researched on 2 October 2026. For the current API reference, supported series types, and version-specific examples, keep the Lightweight Charts documentation open while you build, because many tutorials online were written for version 4 or earlier and will not run unchanged. The code samples below were type-checked against the 5.2.1 typings.
What you get
Six built-in series types: area, bar, baseline, candlestick, histogram, and line, plus a custom series API for new visual types.
A time scale and price scales with panning, zooming, autoscaling, and a crosshair.
Multiple panes inside one chart, introduced in version 5.0.
Plugin hooks, including primitives for annotations, watermark and marker plugins, and an official plugin catalog.
Specialized factories for yield curve charts and options charts with a price-based horizontal axis.
What it is not
The official product comparison page draws the boundary plainly: the library draws financial data on a canvas, and fetching the data, calculating indicators, drawing tools, and the interface around the chart are yours to build. It is a client-side library that is not designed for server-side use, for example in Node.js, and its code targets the ES2020 language level, so the browsers you support must handle that revision.
It also contains no market data. TradingView states that none of its charting products include market data, except widgets that display TradingView's own data. With Lightweight Charts, you bring a feed from your own source or a third-party provider.
Where it tends to fit
Lightweight Charts is particularly well suited to dashboards, portfolio and trading-journal pages, watchlists, embedded sparklines, and internal tools where you already own the data and the surrounding interface. The section titled Is Lightweight Charts the Right Fit? returns to this decision in more detail.
Where the Library Fits in Your Application
Treat the chart as the last stage of a pipeline you own. The library never requests data; it renders only what you pass to setData and update.
Stage | What happens | Owner |
1. Data source | A REST API, WebSocket, file, or database supplies raw prices. | You or your provider |
2. Normalize and validate | Convert to a supported time format, sort ascending, remove duplicates and invalid numbers. | Your code |
3. Initial load | series.setData(history) replaces the dataset once. | You call the API |
4. Incremental updates | series.update(bar) changes the latest bar or appends a new one. | You call the API |
5. Rendering | Canvas drawing, scales, crosshair, and interaction. | The library |
Four kinds of objects cover most of the API. createChart returns a chart object, which owns the scales and panes. chart.addSeries returns a series object, which owns the data and styling. The time scale and price scales control what range is visible. Event subscriptions, such as crosshair move and click, connect the chart to the rest of your interface. Everything else, from legends to toolbars, is ordinary HTML that you place around the canvas.
Because stage two belongs to you, most blank-chart bugs turn out to be data bugs. The troubleshooting section lists the usual suspects.
Install the Library and Draw Your First Chart
Install with npm
Version 5 ships as ES modules and targets ES2020, so it works with modern bundlers and browsers. CommonJS support was dropped in 5.0, and older environments need the package transpiled with a tool such as Babel.
npm install --save lightweight-chartsUse the standalone build in plain HTML
Without a bundler, load the standalone production build, which exposes a global named LightweightCharts. A bare import of lightweight-charts works only where a bundler or an import map resolves the package name. In production, pin an exact version in the script URL instead of floating to the latest release.
<div id="chart" style="height: 360px"></div>
<script src="https://unpkg.com/lightweight-charts/dist/lightweight-charts.standalone.production.js"></script>
<script>
  const chart = LightweightCharts.createChart(document.getElementById('chart'));
  const line = chart.addSeries(LightweightCharts.LineSeries);
  line.setData([
    { time: '2026-09-21', value: 182.4 },
    { time: '2026-09-22', value: 184.1 },
  ]);
</script>
Create a chart and add a series
A chart needs a container element with a real size. If the container has no height, nothing visible is drawn, which is the most common first-run problem. The example below uses the module build and a fixed width and height.
import { createChart, LineSeries } from 'lightweight-charts';

const container = document.getElementById('chart');
const chart = createChart(container, { width: 640, height: 360 });

const line = chart.addSeries(LineSeries, { color: '#2962ff', lineWidth: 2 });
line.setData([
  { time: '2026-09-21', value: 182.4 },
  { time: '2026-09-22', value: 184.1 },
  { time: '2026-09-23', value: 183.2 },
  { time: '2026-09-24', value: 186.7 },
  { time: '2026-09-25', value: 188.0 },
  { time: '2026-09-28', value: 187.3 },
  { time: '2026-09-29', value: 190.5 },
  { time: '2026-09-30', value: 191.2 },
]);

chart.timeScale().fitContent();
Three calls do the work. createChart attaches a chart to the element, addSeries creates a line series, and setData loads the points. fitContent adjusts the time axis so every point is visible. The values are illustrative sample numbers, not market data.
Version warning: in version 4 you would have written chart.addLineSeries(). Version 5 replaced that family of methods with a single addSeries method that takes an imported series definition. If a snippet calls addLineSeries or addCandlestickSeries, it was written for version 4 or earlier.
Data, Time Values, and Series Types
Time values
Every data point carries a time. Lightweight Charts accepts a business-day string in YYYY-MM-DD form, an object with year, month, and day fields, or a UTC timestamp in seconds. Pick one representation per series. Daily and longer bars suit business-day values, while intraday bars need timestamps.
Seconds, not milliseconds. Date.now() returns milliseconds, so use Math.floor(Date.now() / 1000) for a timestamp. A millisecond value places bars far in the future.
Ascending and unique. Times within a series must be sorted from oldest to newest with no duplicates. Sorting and de-duplicating is your job.
Gaps use whitespace points. To leave a gap, supply an object that contains only a time. Do not use null, undefined, or NaN as a value.
The library has no timezone option. Timestamps are treated as UTC, so if you want axis and crosshair labels in an exchange's local time, format them yourself with the timeScale tickMarkFormatter and localization timeFormatter options, for example with Intl.DateTimeFormat. Shifting the source timestamps instead changes where bars sit on the scale, so prefer formatters unless a shift is intentional.
Series types and data shapes
Series | Data fields | Typical use |
LineSeries | time, value | Closing price or an indicator line |
AreaSeries | time, value | Filled trend line or sparkline |
BaselineSeries | time, value | Values above and below a base level |
HistogramSeries | time, value, optional color | Volume or a histogram indicator |
BarSeries | time, open, high, low, close | OHLC bars |
CandlestickSeries | time, open, high, low, close | OHLC with colored bodies and wicks |
Pass series options, such as colors, line width, and price format, as the second argument to addSeries, and change them later with the series applyOptions method. A series cannot change type after it is created, because different types need different data and option shapes. To switch from an area to a candlestick view, remove the old series and add a new one.
Build a Candlestick and Volume Chart
This section builds the main example: candlesticks in the top pane, volume in a second pane, and themed colors. Later sections add interaction and live updates to the same chart. A small generator supplies the data so the example runs anywhere. It produces deterministic sample values and is not market data.
Step 1: sample data and chart options
import {
  createChart,
  CandlestickSeries,
  HistogramSeries,
  ColorType,
} from 'lightweight-charts';

// Deterministic sample data for demonstration only (not market data).
function makeSampleBars(count) {
  const bars = [];
  const day = new Date(Date.UTC(2026, 0, 5)); // a Monday
  let seed = 42;
  const rand = () => {
    seed = (seed * 16807) % 2147483647;
    return seed / 2147483647;
  };
  let close = 100;
  while (bars.length < count) {
    const weekday = day.getUTCDay();
    if (weekday !== 0 && weekday !== 6) {
      const open = close;
      close = Math.max(1, open + (rand() - 0.48) * 4);
      const high = Math.max(open, close) + rand() * 1.5;
      const low = Math.min(open, close) - rand() * 1.5;
      bars.push({
        time: day.toISOString().slice(0, 10), // 'YYYY-MM-DD'
        open: +open.toFixed(2),
        high: +high.toFixed(2),
        low: +low.toFixed(2),
        close: +close.toFixed(2),
        volume: Math.round(100000 + rand() * 900000),
      });
    }
    day.setUTCDate(day.getUTCDate() + 1);
  }
  return bars;
}

const chart = createChart(document.getElementById('chart'), {
  autoSize: true,
  layout: {
    background: { type: ColorType.Solid, color: '#ffffff' },
    textColor: '#1f2937',
  },
  grid: {
    vertLines: { color: '#e5e7eb' },
    horzLines: { color: '#e5e7eb' },
  },
});
Step 2: candlesticks and a volume pane
const bars = makeSampleBars(180);

const candles = chart.addSeries(CandlestickSeries, {
  upColor: '#26a69a',
  downColor: '#ef5350',
  borderVisible: false,
  wickUpColor: '#26a69a',
  wickDownColor: '#ef5350',
});
candles.setData(
  bars.map(({ time, open, high, low, close }) => ({ time, open, high, low, close })),
);

// The third argument is the pane index. Index 1 creates a second pane.
const volume = chart.addSeries(HistogramSeries, { priceFormat: { type: 'volume' } }, 1);
volume.setData(
  bars.map((b) => ({
    time: b.time,
    value: b.volume,
    color: b.close >= b.open ? 'rgba(38, 166, 154, 0.5)' : 'rgba(239, 83, 80, 0.5)',
  })),
);
chart.panes()[1].setHeight(120);

chart.timeScale().fitContent();
A few details are worth noting. The container needs a CSS height, because autoSize makes the chart follow the container's size. The candlestick series receives only the OHLC fields, while the histogram receives value and an optional per-point color; per-point color is the documented way to recolor individual bars, so you do not need extra series or markers for that. Business-day strings suit these daily bars, and the generator emits weekdays in ascending order.
Responsive Sizing, Themes, and Formatting
Responsive behavior
Set autoSize: true and give the container a CSS height. When ResizeObserver is available, the chart tracks its container and repaints on resize. If you want manual control, observe the container yourself and call chart.resize(width, height). While autoSize is active, manual resize calls are ignored, and chart.autoSizeActive() reports whether it is in effect. The width and height options act only as a fallback if ResizeObserver fails.
Light and dark themes
const themes = {
  light: { background: '#ffffff', text: '#1f2937', grid: '#e5e7eb' },
  dark: { background: '#111827', text: '#e5e7eb', grid: '#1f2937' },
};

function applyTheme(name) {
  const t = themes[name];
  chart.applyOptions({
    layout: { background: { type: ColorType.Solid, color: t.background }, textColor: t.text },
    grid: { vertLines: { color: t.grid }, horzLines: { color: t.grid } },
  });
}

const media = window.matchMedia('(prefers-color-scheme: dark)');
applyTheme(media.matches ? 'dark' : 'light');
media.addEventListener('change', (e) => applyTheme(e.matches ? 'dark' : 'light'));
Theme colors are ordinary options, and applyOptions updates the chart in place. You can follow the operating system preference, as above, or your own site toggle. Check contrast in both themes: axis text, grid lines, and the up and down colors must stay distinguishable.
Localization and price formatting
Use localization.locale for date and number formatting and localization.priceFormatter for custom labels, such as a currency symbol. A series' priceFormat option controls precision and can switch the axis to volume or percent formatting. On the time scale, timeVisible and secondsVisible reveal intraday times, which matters once you move from business-day strings to timestamps.
Crosshair, Legends, Markers, and Price Lines
Follow the crosshair with a legend
chart.subscribeCrosshairMove calls your handler whenever the pointer moves. The handler receives the time under the pointer and a seriesData map keyed by series. Outside the data range, time is undefined, and between bars the map may hold no entry, so check both before reading values. Place a legend element above the chart and fill it from the handler.
const legend = document.getElementById('legend');

chart.subscribeCrosshairMove((param) => {
  const bar = param.seriesData.get(candles);
  if (!param.time || !bar || !('close' in bar)) {
    legend.textContent = '';
    return;
  }
  legend.textContent =
    param.time + '  O ' + bar.open.toFixed(2) + '  H ' + bar.high.toFixed(2) +
    '  L ' + bar.low.toFixed(2) + '  C ' + bar.close.toFixed(2);
});
The chart also offers subscribeClick and subscribeDblClick. Version 5.2 added series hit testing, so mouse event payloads now include hoveredItem and hoveredTarget, and a hoveredSeriesOnTop option that draws the hovered series above its neighbors.
Markers
In version 5, markers are a plugin. createSeriesMarkers(series, markers) replaces the old series.setMarkers call, which no longer exists on the series object. Each marker needs a time that matches an existing data point, plus a position, shape, and color. A marker whose time matches no data point will not appear.
import { createSeriesMarkers, LineStyle } from 'lightweight-charts';

const markers = createSeriesMarkers(candles, [
  { time: bars[40].time, position: 'belowBar', color: '#26a69a', shape: 'arrowUp', text: 'Entry' },
  { time: bars[90].time, position: 'aboveBar', color: '#ef5350', shape: 'arrowDown', text: 'Exit' },
]);
// Later: markers.setMarkers([...]) replaces them.
Price lines
series.createPriceLine draws a horizontal line at a price, with an optional axis label and title. It suits reference levels such as an entry, a stop, or a prior close. Markers and price lines are static annotations; anything users draw and drag themselves needs a plugin.
candles.createPriceLine({
  price: 100,
  color: '#6b7280',
  lineWidth: 1,
  lineStyle: LineStyle.Dashed,
  axisLabelVisible: true,
  title: 'Reference',
});
Real-Time Updates with update()
setData replaces the entire dataset, while update changes only the latest bar or appends a new one. TradingView's getting-started guide recommends against using setData for live updates because it replaces all series data and can significantly affect performance.
Method | What it does | Use it for |
setData(array) | Replaces all data and can reset the visible range. | Initial load, symbol or timeframe changes |
update(bar) | Appends when the time is later than the last bar. Replaces the last bar when the time is equal. | Live ticks and bar closes |
update(bar, true) | Updates an older bar. Slower, and it cannot insert missing bars. | Rare corrections |
Turn ticks into bars
Feeds often send trades or quotes rather than finished bars, so aggregate them into buckets that match your timeframe. The function below keeps the current minute bar and calls update with it. This example uses UTC timestamps in seconds and a simulated random-walk feed. The simulation is not market data.
import { createChart, CandlestickSeries } from 'lightweight-charts';

const chart = createChart(document.getElementById('chart'), {
  autoSize: true,
  timeScale: { timeVisible: true, secondsVisible: false },
});
const series = chart.addSeries(CandlestickSeries);

const BAR_SECONDS = 60;
let current = null;

function applyTick(price, timestampMs) {
  const bucket = Math.floor(timestampMs / 1000 / BAR_SECONDS) * BAR_SECONDS;
  if (current && current.time === bucket) {
    current = {
      ...current,
      high: Math.max(current.high, price),
      low: Math.min(current.low, price),
      close: price,
    };
  } else {
    current = { time: bucket, open: price, high: price, low: price, close: price };
  }
  series.update(current);
}

// SIMULATED feed: a random walk, not market data.
let price = 100;
const timer = setInterval(() => {
  price = Math.max(1, price + (Math.random() - 0.5) * 0.4);
  applyTick(+price.toFixed(2), Date.now());
}, 500);
Connect a real feed
A WebSocket, server-sent events, or polling can replace the timer. Whatever the transport, normalize each message before it reaches the chart. YOUR_STREAM_URL below stands for your provider's endpoint, and the field names depend on that provider.
function normalizeTick(message) {
  const price = Number(message.price);
  const timestampMs = Number(message.timestampMs);
  if (!Number.isFinite(price) || !Number.isFinite(timestampMs)) return null;
  return { price, timestampMs };
}

const socket = new WebSocket(YOUR_STREAM_URL);
socket.addEventListener('message', (event) => {
  const tick = normalizeTick(JSON.parse(event.data));
  if (tick) applyTick(tick.price, tick.timestampMs);
});
Two rules keep this reliable. First, load history with setData before streaming, and keep bars in order, because update accepts the latest bar or a newer one but not an older one. Second, after a reconnect, fetch the missed bars, merge them by time, and call setData once instead of replaying every message. When the view goes away, clear the timer, close the socket, and then remove the chart.
Panes, Scales, and Indicators
Panes
Version 5.0 introduced panes. Add a series to a pane with the third argument of addSeries, as the volume example did, or call chart.addPane() and then pane.addSeries. Adding a series at an index one past the current pane count creates the pane. Size panes with pane.setHeight in pixels or with setStretchFactor, which sets relative sizes. Keep a reference to a pane object if panes can move, and read its current position with paneIndex().
Price scales and the time scale
Each pane has its own price scales. Series use the right scale by default, and a series with its own priceScaleId becomes an overlay with a hidden, autoscaled scale unless you make it visible. On the chart object, priceScale requires an id, and in multi-pane charts you pass the pane index as well. Scale margins reserve space above and below the data, and PriceScaleMode switches between normal, logarithmic, percentage, and indexed modes.
The time scale offers fitContent, setVisibleRange for time bounds, and setVisibleLogicalRange for bar indices, which is a different unit from time. To load older history when users scroll left, subscribe with timeScale().subscribeVisibleLogicalRangeChange, fetch earlier bars, and call setData with the combined array. The library has no prepend method.
Indicators
Lightweight Charts does not calculate indicators. You compute the values and plot them as another series, as the official indicator tutorials do. The moving average below adds one line to the candlestick chart.
import { LineSeries } from 'lightweight-charts';

function sma(bars, period) {
  const out = [];
  let sum = 0;
  for (let i = 0; i < bars.length; i++) {
    sum += bars[i].close;
    if (i >= period) sum -= bars[i - period].close;
    if (i >= period - 1) out.push({ time: bars[i].time, value: +(sum / period).toFixed(2) });
  }
  return out;
}

const sma20 = chart.addSeries(LineSeries, { color: '#f59e0b', lineWidth: 2 });
sma20.setData(sma(bars, 20));
The function emits points only after enough bars exist, so the line starts later than the candles. For live data, update the running sum with each new bar instead of recomputing the whole array on every tick.
Plugins, Primitives, and Custom Series
Two extension mechanisms exist. Primitives attach drawing code to a series or a pane through attachPrimitive, which suits annotations, highlights, and tools. A custom series implements the ICustomSeriesPaneView interface and is added with chart.addCustomSeries; it behaves like a built-in series, with data, scales, and autoscaling, so reserve it for new series types.
TradingView supplies a plugin catalog and interactive examples on the documentation site, a create-lwc-plugin scaffold, text and image watermark plugins, an up/down markers plugin, and the accessibility plugin covered below. The library has no built-in interactive drawing tools. An interactive tool needs a primitive for rendering plus event handlers, such as subscribeClick and subscribeCrosshairMove, that convert pointer positions with public methods like coordinateToPrice and timeToCoordinate.
Using Lightweight Charts with React
The core package is framework-agnostic, so React integration is a matter of lifecycle. TradingView publishes React, Vue, and web component tutorials, and community wrappers exist, but check that a wrapper supports version 5 before you depend on it. The component below shows the pattern with no wrapper: create the chart once, replace the data only when the history changes, and apply live changes with update.
import { useEffect, useRef } from 'react';
import { createChart, CandlestickSeries } from 'lightweight-charts';

export function PriceChart({ history, latestBar }) {
  const containerRef = useRef(null);
  const chartRef = useRef(null);
  const seriesRef = useRef(null);

  // Create the chart once; clean it up when the component unmounts.
  useEffect(() => {
    const chart = createChart(containerRef.current, { autoSize: true });
    chartRef.current = chart;
    seriesRef.current = chart.addSeries(CandlestickSeries);

    return () => {
      chart.remove();
      chartRef.current = null;
      seriesRef.current = null;
    };
  }, []);

  // Replace the whole dataset only when the history itself changes.
  useEffect(() => {
    if (!seriesRef.current) return;
    seriesRef.current.setData(history);
    chartRef.current.timeScale().fitContent();
  }, [history]);

  // Apply live changes incrementally.
  useEffect(() => {
    if (seriesRef.current && latestBar) seriesRef.current.update(latestBar);
  }, [latestBar]);

  return <div ref={containerRef} style={{ height: 360 }} />;
}
Strict Mode. In development, React mounts, cleans up, and mounts again. The cleanup function must fully dispose the chart with chart.remove(), or you will see duplicate charts and leaked listeners.
No chart per render. Creating a chart inside the render path duplicates DOM and listeners. Keep the chart in a ref.
Server rendering. The library is for the browser. In Next.js, put chart code in a client component, create the chart in an effect, and load the component with next/dynamic and ssr set to false where a server-rendered page imports it.
Container height. The wrapper div still needs a real height from CSS or an inline style.
Performance Practices
Performance guidance here sticks to what the documentation and release notes support. TradingView does not publish a point-count or frame-rate guarantee on its documentation site, so measure with your own data volume and target devices.
Update incrementally. Use update for live changes. Reserve setData for loading history or changing the dataset.
Keep hot paths light. Crosshair handlers fire constantly, so avoid heavy DOM work and allocations in them. An autoscaleInfoProvider function runs during layout, so keep it cheap as well.
Consider conflation for very large datasets. Version 5.1 added opt-in data conflation, enabled with the enableConflation option, which merges points when zoomed out so that many points are not drawn within a fraction of a pixel. It is off by default, and the release notes position it for datasets in the tens of thousands of points or more.
Track fixes. Version 5.2.1 reduced crosshair and hover cost on charts that combine markers with large datasets, and earlier 5.0.x releases fixed marker slowdowns on charts with 15,000 or more points.
Calculate once. Compute indicators on history once and extend them incrementally as bars arrive.
Dispose. Remove charts, clear timers, and close sockets when a view unmounts.
Accessibility
A canvas is opaque to assistive technology. TradingView's own accessibility tutorial states that Lightweight Charts has no built-in accessibility attributes, so accessibility is work you plan for rather than a switch you flip. Cover these areas:
Keyboard operation. Make the chart container focusable and map keys to actions such as scrolling and zooming through the time scale API.
ARIA and announcements. Label the chart, expose a text summary, and use a live region for updates that users need to hear.
Text alternatives. Offer the same data as a table or summary near the chart.
Contrast and color. Check contrast in every theme, and do not rely on red and green alone. Use text, marker shapes, or line styles as well.
Surrounding controls. Timeframe selectors, toggles, and legends are normal HTML, so label them and keep them keyboard reachable.
TradingView also publishes an official accessibility plugin, @tradingview/lwc-plugin-accessibility, version 1.0.0 at the time of writing. It requires lightweight-charts 5.0.0 or later and packages keyboard navigation, screen-reader announcements, and a visible focus indicator on each pane. Its commands include next and previous point, series switching, summaries, help, and a table view.
import { addAccessibilityPlugin } from '@tradingview/lwc-plugin-accessibility';

const accessibility = addAccessibilityPlugin(chart, {
  chartTitle: 'Daily candlesticks, sample data',
});

// When the chart is torn down:
accessibility.detach();
Accessibility caution: the plugin's package description says it helps meet WCAG 2.1 Level AA. That is not a conformance claim for your page. Test with a keyboard, with a screen reader, and against your own accessibility requirements.
Is Lightweight Charts the Right Fit?
The decision depends on how much of the charting experience you want to own. The table separates what the library does from what stays with your team.
Requirement | In the library? | Your responsibility |
Candlestick, line, area, bar, histogram charts | Yes | Supply clean data |
Pan, zoom, crosshair, scales | Yes | Configure options |
Market data | No | Choose a provider, transport, and data terms |
Indicators | No | Calculate and plot as series |
Drawing tools | No, plugins only | Build or adopt a plugin |
Toolbars, symbol search, legends | No | Build the HTML interface |
Saved layouts | No | Persist options and data yourself |
Accessibility | Partial, through a plugin | Design and test |
TradingView keeps its charting products distinct. Per the official product comparison, Advanced Charts is a ready-made charting application with toolbars, symbol search, more than 100 indicators, drawing tools, and layout saving, and it connects to your data through a Datafeed API. It is not published on npm; you request access and are invited to a private GitHub repository. Trading Platform adds order tickets, positions, and an account manager for trading front ends. Widgets embed a TradingView-hosted chart from a snippet with no code of your own, and you cannot connect your own data to them. Lightweight Charts and Advanced Charts share no API, so code written for one does not carry over to the other.
Lightweight Charts is particularly well suited to projects where a small bundle, full control of the interface, and your own data pipeline matter more than built-in features. It fits teams comfortable writing the surrounding application code. It may not be the best choice when users expect built-in drawing tools, dozens of ready-made indicators, symbol search, and saved layouts on day one, when you have no data source and want hosted data, or when your team cannot spend time on accessibility and interface work. In those cases, evaluate Advanced Charts or a widget against your requirements, and compare other charting libraries on the same checklist.
Licensing, Attribution, and Production Notes
The npm package metadata lists the Apache-2.0 license. The project README adds an attribution requirement: the license requires naming TradingView as the product creator. It asks you to put the attribution notice from the repository's NOTICE file, together with a link to tradingview.com, on a public page of your website or app. The NOTICE file currently contains a TradingView copyright line and the company's web address.
The attributionLogo chart option, which defaults to true, displays a TradingView link on the chart, and the typings state that this satisfies the link requirement. They also note that you may disable the logo if you already provide the link elsewhere. This is a summary of what the project asks, not legal advice. Read the LICENSE and NOTICE files in the repository and consult counsel if your situation is unclear.
Pin the library version and review the release notes before upgrading.
Use the production build and test on the browsers you support, since the code targets ES2020.
Check your data provider's terms for display and redistribution before shipping.
Handle feed errors, reconnects, and empty states, and dispose of charts on navigation.
Troubleshooting Common Problems
Symptom | Likely cause | Fix |
Blank chart, no error | The container has zero height, or it was hidden when the chart was created. | Give the container a CSS height and use autoSize. |
Data does not appear | Unsorted or duplicate times, or non-numeric values. | Sort ascending, remove duplicates, and validate numbers. |
Bars sit far in the future or in 1970 | Timestamps are in milliseconds, or a date was parsed incorrectly. | Use whole seconds, or business-day strings. |
addLineSeries is not a function | A version 4 snippet is running on version 5. | Use chart.addSeries(LineSeries, options). |
series.setMarkers is not a function | Markers moved to a plugin in version 5. | Use createSeriesMarkers(series, markers). |
Chart does not resize | autoSize is off, or the container has a fixed size. | Enable autoSize, or call chart.resize from a ResizeObserver. |
Duplicate charts or leaks in React | The effect creates a chart but never removes it. | Call chart.remove() in the cleanup function. |
window or document is not defined | Chart code ran on the server. | Create the chart in a client-only effect. |
Live update changes the wrong bar | The bar time does not match your timeframe bucket. | Round times to the bucket; equal time replaces the last bar. |
update throws on an older bar | The new bar is older than the latest bar. | Keep feed order, or call setData after merging. |
Volume squashes the candles | Both series share one price scale. | Put volume in its own pane or give it its own scale. |
Series appears in the wrong pane | Wrong pane index. | Check chart.panes() and the third addSeries argument. |
FAQ
Is TradingView Lightweight Charts free and open source?
Yes. It is published on npm under the Apache-2.0 license, and the source is on GitHub. The license comes with an attribution requirement, described in a separate question below, so read the LICENSE and NOTICE files before you ship.
Does Lightweight Charts provide market data?
No. It draws the data you pass to it and never requests anything itself. TradingView says its charting products contain no market data, apart from widgets that display TradingView's own data. Use your own source or a third-party provider, and check that provider's terms before displaying or redistributing prices.
Can Lightweight Charts draw candlestick charts?
Yes. Import CandlestickSeries, add it with chart.addSeries(CandlestickSeries, options), and pass objects with time, open, high, low, and close to setData. A bar series draws the same OHLC data as vertical bars with tick marks, and per-point color fields let you recolor individual candles.
Does Lightweight Charts work with React, Vue, or Next.js?
Yes, because the core library is framework-agnostic. Create the chart in a mount effect, dispose of it with chart.remove() in the cleanup function, and update data through refs. TradingView publishes React, Vue, and web component tutorials. In Next.js, keep the chart in a client component so chart code never runs on the server.
How do I update a chart in real time?
Load history with setData once, then call update with each new or changed bar. The update method replaces the latest bar when the time matches and appends a bar when the time is newer. Aggregate ticks into bars yourself, keep times ascending, and avoid calling setData on every tick.
How do I make a Lightweight Charts chart responsive?
Set autoSize to true in the chart options and give the container a CSS height. The chart then follows its container with ResizeObserver. For manual control, observe the container yourself and call chart.resize(width, height), remembering that manual resize calls are ignored while autoSize is active.
Does Lightweight Charts include technical indicators?
No. You calculate indicator values in your own code and plot them as additional line, histogram, or other series, in the main pane or a separate pane. TradingView's documentation includes indicator tutorials. Advanced Charts, a separate product, ships with a library of built-in indicators.
Does Lightweight Charts include drawing tools?
Not as a built-in feature. Markers and price lines cover static annotations. For interactive drawing, write a plugin or take one from the plugin catalog on the documentation site. Advanced Charts, a different TradingView product with a different API, includes drawing tools.
Can I show volume or use multiple panes?
Yes. Since version 5.0 a chart can hold multiple panes. Add a histogram series with the volume price format to a second pane by passing the pane index as the third argument to addSeries, then size the panes with setHeight or stretch factors.
Why is my Lightweight Charts chart blank?
The usual causes are a container with no height, data that is unsorted, duplicated, or contains invalid numbers, timestamps in milliseconds instead of seconds, and version 4 snippets that call removed methods. Check the container's computed height first, then validate the data array.
Can Lightweight Charts run on the server or in Node.js?
No. The documentation describes it as a client-side library that is not designed for server-side use. In server-rendered frameworks, create charts in the browser only, for example inside an effect, and render a plain container element on the server.
What changed in Lightweight Charts version 5?
Version 5.0 introduced a unified addSeries method that takes an imported series type, replacing addLineSeries and similar helpers. Markers and watermarks became plugins, multiple panes arrived, yield curve and options chart types were added, CommonJS support was dropped, and the code targets ES2020. TradingView provides a v4 to v5 migration guide.
What attribution does Lightweight Charts require?
The README says the license requires specifying TradingView as the product creator. Add the attribution notice from the NOTICE file and a link to tradingview.com to a public page of your site or app. The attributionLogo option shows a TradingView link on the chart. This is not legal advice, so read LICENSE and NOTICE.
When should I use Advanced Charts or a widget instead?
Choose Advanced Charts when you need a ready-made charting application with toolbars, symbol search, many indicators, drawing tools, and layout saving, and you can connect data through its Datafeed API. Choose a widget when you have no data of your own and want an embedded TradingView chart without writing code. Choose Lightweight Charts when you own the data and the interface.
Key Takeaways
Treat Lightweight Charts as the rendering stage of a pipeline you own: source, normalize, setData, update, render.
Version 5 code uses imported series types with addSeries and createSeriesMarkers, so verify older snippets before you reuse them.
Time values cause the most bugs: keep them ascending, unique, in one format per series, and in seconds for timestamps.
Panes make price-plus-volume layouts straightforward, and per-point colors handle up and down coloring.
Create each chart once, dispose of it in cleanup, and keep chart code in client-only paths.
Measure performance with your own data, and consider conflation only for very large datasets.
Accessibility work, license attribution, and data-provider terms are decisions to make before launch.
Fit depends on how much of the interface you want to build, so compare your requirements with Advanced Charts or widgets honestly.
Actionable Next Steps
Install lightweight-charts, confirm the current version on npm, and render the first line chart with sample data.
Replace the sample data with a normalized sample from your own provider: ascending unique times and numeric values.
Switch to candlesticks, add a volume pane, and set autoSize with a theme-aware palette.
Add the crosshair legend, markers, and price lines your users need.
Wire live updates: load history first, aggregate ticks into bars, call update, and handle reconnects.
Add accessibility support with the official plugin, a text summary, and labeled controls, then test with a keyboard and a screen reader.
Review the LICENSE and NOTICE files, add the attribution, pin the library version, and test your target browsers.
Re-check the requirements table. If you need built-in tools, evaluate Advanced Charts or a widget before building them yourself.
Glossary
Series: one set of data drawn in a chart, such as a line or a set of candlesticks.
OHLC: open, high, low, and close, the four prices that describe a bar.
Candlestick: an OHLC bar drawn with a body between open and close and wicks to the high and low.
Time scale: the horizontal axis that controls the visible time range.
Price scale: a vertical axis that maps prices to positions, with autoscaling and modes.
Crosshair: the pointer-following lines and labels that show the time and price under the cursor.
Pane: a vertically stacked area of a chart that can hold its own series and scales.
Marker: a shape and optional text attached to a data point, created with createSeriesMarkers.
Price line: a horizontal line drawn at a chosen price.
Primitive: a plugin object that attaches custom drawing code to a series or pane.
Custom series: a new series type defined by implementing ICustomSeriesPaneView.
Whitespace point: a data item with only a time, used to leave a gap.
Conflation: an opt-in optimization that merges points when zoomed out.
ESM: ECMAScript modules, the import and export module format version 5 ships in.
WebSocket: a browser API for a persistent two-way connection, often used for live prices.
setData: the series method that replaces all of a series' data.
update: the series method that changes the latest bar or appends a newer one.
Attribution: the credit to TradingView that the project asks you to display, as described in its NOTICE file and README.
Sources & References
Getting started (version 5.2). TradingView, Inc. n.d. https://tradingview.github.io/lightweight-charts/docs
Series (version 5.2). TradingView, Inc. n.d. https://tradingview.github.io/lightweight-charts/docs/series-types
Release Notes. TradingView, Inc. n.d. (reviewed through 5.2.1). https://tradingview.github.io/lightweight-charts/docs/release-notes
Product comparison. TradingView, Inc. n.d. https://tradingview.github.io/lightweight-charts/docs/product-comparison
Migrating from v4 to v5. TradingView, Inc. n.d. https://tradingview.github.io/lightweight-charts/docs/migrations/from-v4-to-v5
Improving accessibility (tutorial). TradingView, Inc. n.d. https://tradingview.github.io/lightweight-charts/tutorials/a11y/intro
Accessibility plugin. TradingView, Inc. n.d. https://tradingview.github.io/lightweight-charts/plugins/accessibility
lightweight-charts, version 5.2.1 (package metadata and TypeScript typings). npm, published 2026-08-12. https://www.npmjs.com/package/lightweight-charts
@tradingview/lwc-plugin-accessibility, version 1.0.0. npm, published 2026-09-16. https://www.npmjs.com/package/@tradingview/lwc-plugin-accessibility
tradingview/lightweight-charts, README. TradingView, Inc., GitHub. n.d. https://github.com/tradingview/lightweight-charts
LICENSE (Apache License 2.0). TradingView, Inc., GitHub. n.d. https://github.com/tradingview/lightweight-charts/blob/master/LICENSE
NOTICE. TradingView, Inc., GitHub. n.d. https://github.com/tradingview/lightweight-charts/blob/master/NOTICE
Lightweight Charts Agent Skill (SKILL.md). TradingView, Inc., GitHub. n.d. https://github.com/tradingview/lightweight-charts/blob/master/.github/skills/lightweight-charts/SKILL.md


